
![]() Go to Dashboard → Today/Yesterday/This week/This month.
Go to Dashboard → Today/Yesterday/This week/This month.
Your Dashboard is your one-stop section to instantly have an overview of your activity from the last 24 hours/previous day or from the last 7/30 days.
In a single click, get all your consolidated transaction data and key performance indicators for acute monitoring and in-depth analysis!
For a good grasp of the big picture, the dynamic graph indicates the number of successful transactions and earnings of the selected account(s) ![]() , for all sites, based on the time frame chosen.
, for all sites, based on the time frame chosen.
It also shows the progression in percentages.
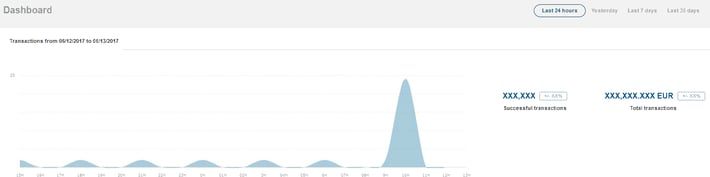
Moreover, your Dashboard gives you quick access to all the statistics related to your activities for a selected time period:
- Average transaction value,
- Success rate,
- Chargeback rate,
- Refund rate,
- New buyer,
- Unique buyer.
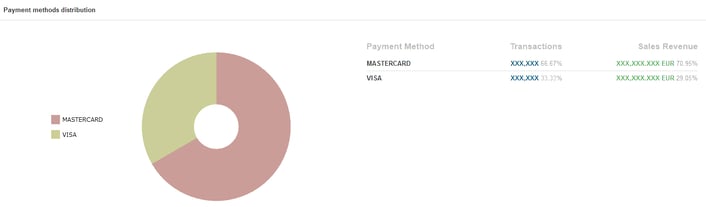
The Payment methods distribution is another great feature for quick data mining.
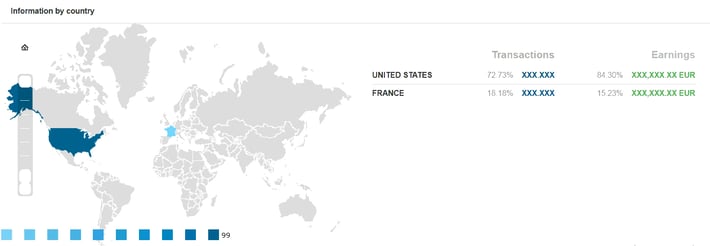
And for an even bigger picture (and world-class service), your Dashboard gives you information by country based on your geographic coverage.
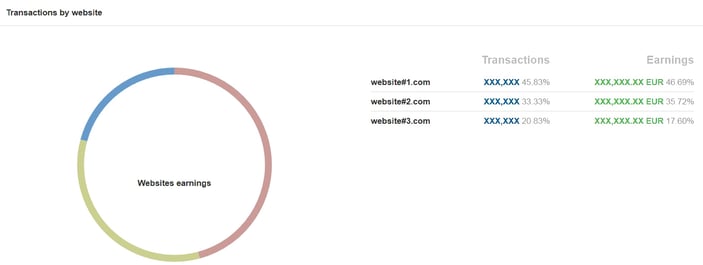
Last but not least for more detailed information, a breakdown by website clearly makes it easier to understand your business results.
![]() Quick tip: click on
Quick tip: click on ![]() to access each and every transaction and get all the data you need for thorough analyses.
to access each and every transaction and get all the data you need for thorough analyses.
